sentix Euro Break-up Index
The sentix Euro Break-up Index (EBI) indicates the probability that the euro will break up within the next twelve months as perceived by investors. Since the perceived risk of a break-up of the euro zone is an important determinant of the yields of euro zone government bonds, the indicator is suitable for increasing understanding of the development of these yields and improving their forecasts. In addition, there are national sentix Euro Break-up Indices which reflect the assessment of investors of the probability of the euro exit of individual countries. These indices help to uncover relative mispricings between eurozone government bonds. Finally, the "Index for the Risk of Spread" provides an additional risk measure that complements the EBI.
How to use the indicator
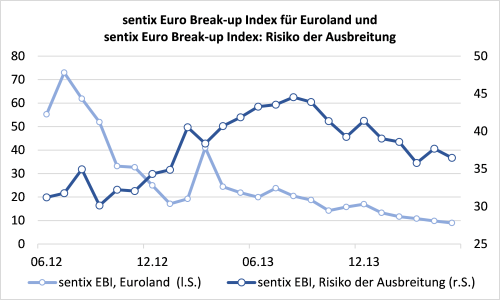
sentix Euro Break-up Index for Euroland
The sentix Euro Break-up Index (EBI) for Euroland indicates the percentage of investors who, at a certain point in time, expect at least one country to leave the Euro zone within the next twelve months. It can therefore be interpreted as the probability of the euro breaking apart within this period.
The risk of the euro breaking apart is an important determinant of eurozone government bond yields. This is because a "euro break-up" would, on the one hand, change the probability of default on the bonds of the country leaving the euro and, on the other hand, change the valuation of these bonds by investors. On the other hand, there would also be a general change in the perception of the default probabilities of all euro area bonds - with effects on the yields of the other euro area government bonds as well. However, this would have different effects on the securities of the so-called peripheral countries and those of the so-called core countries (see the comments below).
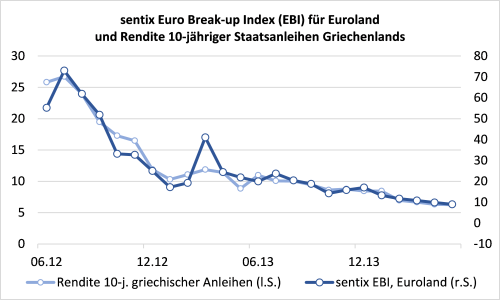
Against this background, the index can basically be used as a forecasting instrument for the development of yields on eurozone government bonds. This is illustrated, for example, by Chart 1, in which the ECI tends to show a lead over the development of yields (here: 10-year Greek bonds). This lead is due to the fact that the ECI reflects investors' expectations and - changed - expectations are usually followed by transactions (and price movements) in order to adjust old portfolio holdings to the new expectations and thus dissolve cognitive dissonances that have arisen in the meantime.
However, situations may also arise in which a majority of investors refuse to accept certain financial market developments without having more knowledge. In such cases, expectations lose their character as a directional indicator for yield developments. Sooner or later, expectations will be corrected when investors can no longer ignore price developments. The consequence is then often an intensification of the observable price trend. In order to identify whether or not such a refusal is present, further information must be obtained: by analysing the media response and the currently formative research opinions and by means of additional indicators. In the case of the ECI, for example, the sentix business cycle index can have a supporting effect: If, for example, economic expectations for the ECI are pointing noticeably downwards (which makes it more difficult, for example, to restructure government budgets), while the ECI is also falling (the risk of break-up is therefore assessed as lower), this inconsistency would indicate that investors have become too careless with regard to the risks of the euro break-up.
National sentix Euro Break-up Indices
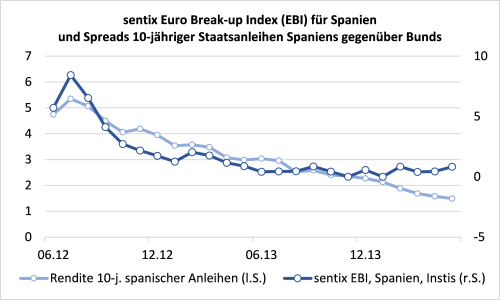
In addition to the sentix EBI for Euroland, which generally indicates the likelihood of the euro breaking up from an investor's perspective, there are also the national sentix Euro Break-up Indices. These reflect the respective euro exit probabilities for the individual euro countries. In principle, the national ECIs can also act as a directional indicator, namely for the yield development of the corresponding national government bonds (see Figures 2 and 3). However, there are differences between peripheral and core countries in the relationships between ECIs and yields (see explanations below).
A further scope of application of national ECIs is that of the relative valuation of euro area government bonds. Assuming that there is a certain relationship between national ECIs and related government bond yields, this relationship should be broadly the same across countries. If, however, deviations from the observable correlation occur here for individual countries, this would be an indication that there is a distortion in relative yields, which should normally decrease over time. Since the correlations for the core countries of the eurozone and for the so-called peripheral countries differ, they will be explained separately below.
National ECI and 10-year government bond yields for the peripheral countries
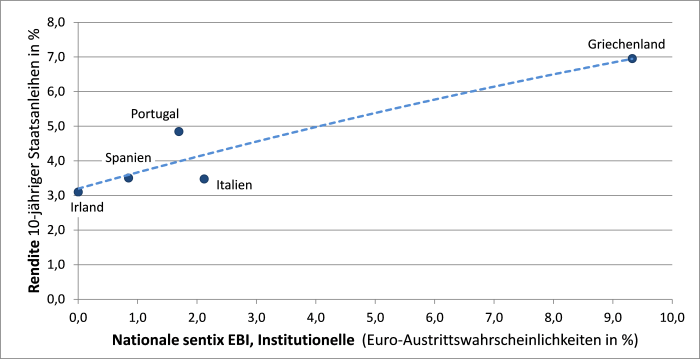
Figure 4 illustrates the relationship between national ECIs and yields on government bonds of peripheral countries. It shows 10-year yields and the ECI resulting from the assessments of institutional investors as of February 2014. It shows that for the peripheral countries there is a positive correlation between national ECI and bond yields. This is explained by the fact that a higher probability of a peripheral country leaving the euro also means a higher probability of default on its bonds, for which investors in turn demand a higher risk premium in the form of a yield premium.
Figure 4 shows a clear distortion in the relative returns of Portuguese and Italian bonds when using the national ECI as a benchmark. This is because the data point for Portugal is above the established relationship (i.e. above the regression line) between national ECIs and related yields. As a result, Portuguese bonds - measured against the ECIs - have too high a yield relative to the other peripheral country bonds. The reverse is true for Italian bonds. As a result, Portuguese bonds were clearly mispriced compared with Italian bonds at the time under review, i.e. they were too cheap (or Italian bonds relatively too expensive). And indeed, in the weeks following the end of February 2014 the yield gap between the bonds of the two countries narrowed considerably!
National ECI and 10-year government bond yields for core countries
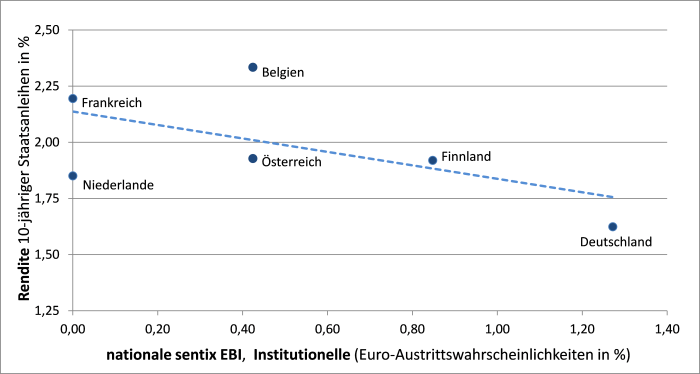
Distortions in government bond yields can also be identified for the core countries of the euro zone with the help of the national ECI. However, the correlation here is different: for the core countries a rising national ECI is accompanied by falling yields. This can be explained by the fact that investors in the core countries are prepared to pay security premiums to ensure that a country can leave the euro from a position of strength if necessary. The premium is justified, among other things, by the fact that after the euro exit of a core country the new currency of the country leaving the Union is likely to appreciate against other currencies - and thus also against the euro. This would reduce the burden of foreign-currency debt and lower the probability of bond default.
The correlation described is shown in Chart 5, which in turn compares the national ECIs of institutional investors with the yields of 10-year government bonds. In fact, the higher the euro exit probability perceived by investors, i.e. the higher the ECIs are quoted, the lower the yield here. A conspicuous distortion is evident here with Belgian government bonds, which have too high a yield compared with the national EBIs. This is especially evident in comparison to Austrian bonds, for which investors in February 2014 considered a euro exit to be just as likely as for Belgium. Nevertheless, Belgian bonds yielded much higher returns at that time. This yield differential should narrow over time, although it is unlikely to disappear completely due to the existence of other country-specific factors influencing yields.
sentix Contagion Risk Index
The sentix Contagion Risk Indicator is a weighted average of the indices of the three countries with the highest national euro breakup indices (see Figure 6). The value of the country with the second highest national ECI is weighted twice and the value of the country with the third highest national ECI is weighted three times to accentuate the index.
The sentix Contagion Risk Index is not calculated on the basis of the national ECIs themselves, but on the basis of the share of the denominations of a country in the total denominations of all countries for which investors expect a euro withdrawal in the next 12 months.
An example: In February 2013, around 80% of those investors expecting at least one country to exit the euro expected Greece to leave the euro. This figure of 80% is included in the "Contagion Risk Indicator" calculation. To this were added the corresponding figures for Cyprus (57%) and Italy (16%), with a double weighting for Cyprus and a triple weighting for Italy. This resulted in a "Contagion Risk Indicator" of around 40%.
The calculation of the sentix Contagion Risk Indicator is independent of the level of the sentix Euro Break-up Index (total), because the process of spreading can be regarded as largely independent of the overall probability of the euro breaking up. The sentix Contagion Risk Indicator is thus a separate risk measure in addition to the sentix Euro Break-up Index (for Euroland), which provides important additional information on how likely investors are to believe that several countries will break out of the euro at a given point in time within a one-year period. This additional information is particularly valuable in times when the sentix EBI assumes relatively high values and thus signals a high break-up probability. This is because the more or less simultaneous euro exit of several countries is likely to have far more far-reaching consequences for the financial markets than the exit of just one individual country.
Illustration and examples
Indicator construction
Questionaire
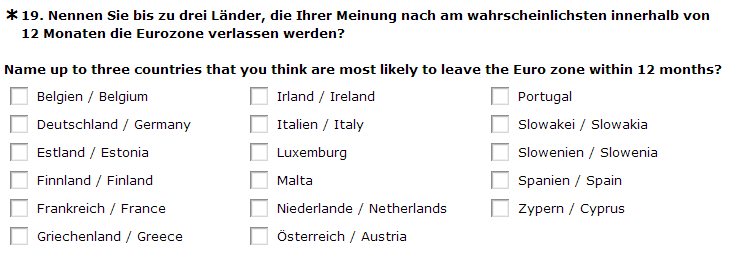
The question on the sentix Euro Break-up Index is divided into two parts. First, investors are asked whether they expect at least one country to leave the Eurozone within the next 12 months (see below, survey menu item no. 18). If this question is answered with "yes", an overview appears for the survey participant, with the help of which he can name up to three countries whose euro exit he expects (see below, survey menu item no. 19).
Calculation formula


Specifications
- Code: SEBI
- No. Serien: 63
- Start: 2012-06-21
- Rhythm.: monthly
- Fristigkeit: Lage
- Investor: Institutionelle, Privatanleger, Headline Index
- Land / Region: Euro area
- Frei verfügbar: sentix Website, Bloomberg L.P., Factset Research Systems Inc., IHS GlobalInsight, Refinitiv, Macrobond Financial, Haver Analytics





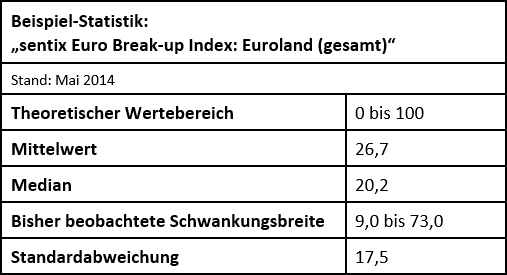 Descriptive statistics - sentix Euro Break-up Index (total index) - Source: own calculations
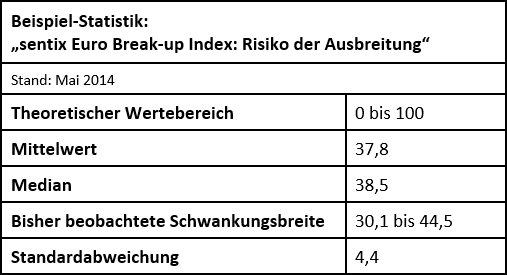 Descriptive statistics - sentix Euro Break-up Index (Contagion Risk Index) - Source: own calculations
Customer Feedback (0)