sentix Investor positioning
The sentix investor positioning is a measure of how strongly investors are invested in a market. With its help, market timing can basically be made or improved. Unlike most sentix indices, sentix Investor Positioning is not an indicator that reflects expectations shaped by emotions or the ratio. Positioning data is data from the area of "action": Here, facts have already been created in the form of transactions that have led to corresponding securities holdings. It therefore becomes particularly exciting in situations where these facts no longer correspond to the expectations of the investors and / or the price development. Then cognitive dissonances arise that demand resolution.
How to use the indicator
The sentix investor positioning is used in research in various ways: For example, the index can be used as a directional indicator for the price development on the market under consideration. Its use as a contrarian indicator is also widespread when the index moves into extreme ranges. Finally, a divergence of positioning and prices in any market phase can be an indication that the current price movement will soon be reinforced by portfolio adjustments - to clear up the cognitive dissonance that has arisen. The sentix Investor Positioning can be used in isolation or in combination with other indicators, e.g. with the sentix Strategic Bias and the sentix Sentiment.
The decisive factor is the breadth of participation! Or: Of shaky and strong hands
The question is often asked how it can be that the positioning is first very high and later extremely low within a relatively short period of time? What then happens to the securities under consideration, e.g. European shares? Where do they disappear to?Essentially, in the case of falling (overall) positioning data, these shares move away from the broad mass of investors to only a very few investors who are usually equipped with a higher risk-bearing capacity. The "shaky hands" then pass on their securities to the "strong hands", so to speak. In an extreme case, only one (respondent) investor would still hold all the shares. In this case, the average investment level of all investors would be close to zero according to sentix investor positioning (due to its construction) - also because the investment level that can be specified in the survey is capped (see also "Questioning" and "Calculation of sentix investor positioning" below).
The effect of benchmark adjustments
Another reason why the measured investment level fluctuates over time is that the question asked to determine sentix investor positioning is a relative one: investors are asked to indicate what their actual or recommended investment level is in relation to their "benchmark". However, such "benchmarks" are adjusted over time as investors' risk appetites and / or risk budgets change. For example, if investors are overweight in equities and then prices rise, this tends to increase risk budgets. At the same time, the risk appetite increases on average in such a situation (overconfidence effect). Both usually lead to upward benchmark adjustments.To illustrate the effect of such an adjustment on the investment ratio, let us assume an extreme example: In this situation, if all investors raise their equity benchmarks at the same time, the investment degree of the sentix investor positioning falls, without anything having changed in the distribution of dividend stocks among the investors. This effect tends to cloud the sentix Investor Positioning's property as a directional indicator and is behind some countermovements in the indicator's trends that can be observed.
For the most part, the positioning measured by sentix runs ahead of the prices. Why?
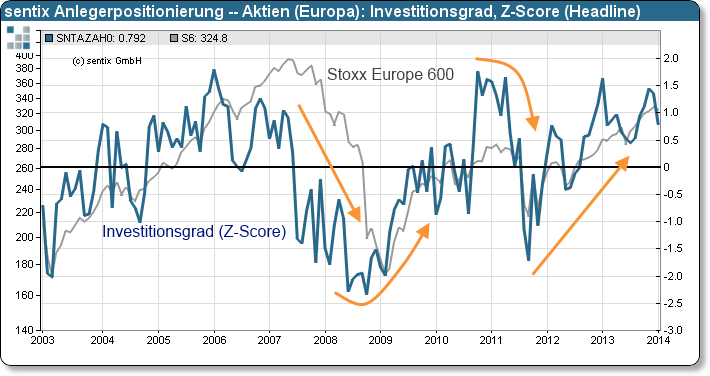
Typically (cf. Figures 1 and 4), however, the sentix investor positioning runs ahead of the price development and can thus function as a directional indicator. The fact that there is a positive correlation between the positioning and the price of the market under consideration is initially explained by the increasing (decreasing) number of buyers that appear in the case of increasing (decreasing) positioning on the market under consideration. The fact that the sentix investor positioning also tends to have a slight lead time before the price development is due to the fact that the positioning statements made by the investors often still result in transactions. This is all the more true as in the sentix survey the analysts among the survey participants give their positioning recommendations. However, these recommendations are only followed by portfolio adjustments and transactions with a certain time lag, which in turn have corresponding effects on the price.These considerations also explain why it is obvious that trend reversals are imminent in extreme areas of investment degrees, i.e. why sentix investor positioning is used here as a contrary indicator. Because then it is very unlikely that additional buyers or sellers will come into the market to further support the current trend. A high positioning (a high degree of investment) is therefore basically understood as a burden for the prices, a low one as a support.
The case of positioning and price drifting apart
If investors have a pronounced positioning (on one side or the other) and the price on the market under consideration then develops against them, a tension arises that must be resolved. This is because the positioning that was entered into on the basis of certain expectations no longer matches reality. If, for example, shares were bought in anticipation of rising prices and then prices fall, there is a gap between price expectations and actual price development. This creates a cognitive dissonance. To resolve this, investors will sell their shares after a certain time - unless prices recover. However, such portfolio adjustments will then lead to the already observable price development being reinforced; in the example, the increasing number of sellers would cause share prices to fall further.
Under- and over-investment, neutrally invested investors
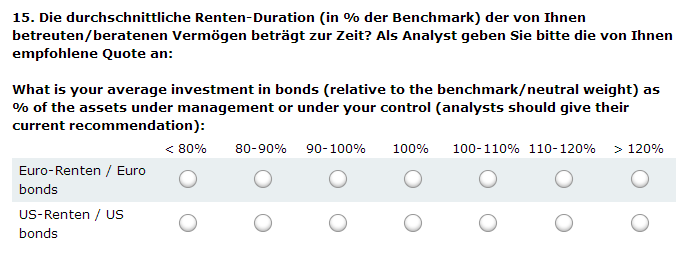
In the sentix investor positioning indicator family, in addition to the investment degrees already described, which represent average values across all investors, there are also indicators that reflect the investment behaviour of only some of the investors.These indicators are, on the one hand, the underinvestment and overinvestment indices. The underinvestment index (exact name: "extreme underinvestment") on the bond markets indicates the portion of investors who are invested below 80% in relation to the benchmark. The corresponding indicator for the equity markets corresponds to the share of investors who maintain short positions. The overinvestment indices represent for both markets the part of investors who are invested above 100% relative to the benchmark.
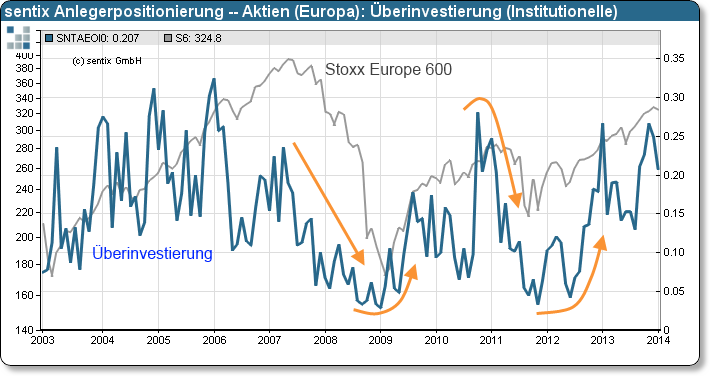
The sentix underinvestment and overinvestment indicators are measures of investors' propensity to speculate. the higher the propensity to speculate, the higher the probability that the market is over-extended in the direction indicated by the propensity to speculate. In this respect, these indices are essentially to be used as contrarian indicators. However, the comparison of Figures 1 and 3 also shows (here for the European stock market) that they, like the average investment degrees, also have qualities as directional indicators. Their movements are more pronounced than those of the average investment grade.
On the other hand, there is the group of neutrally invested investors, whose share of all investors is reflected by the sentix indicator of the same name. This group shies away from investment risks compared to the benchmark. A high ratio is usually recorded when investors have compensated for bad positions due to stop-loss measures. It can also be observed that the longer a trend has been running, the larger the group of neutrals becomes. The indicator thus gives indications of impending trend exhaustion.
Institutional and private investors
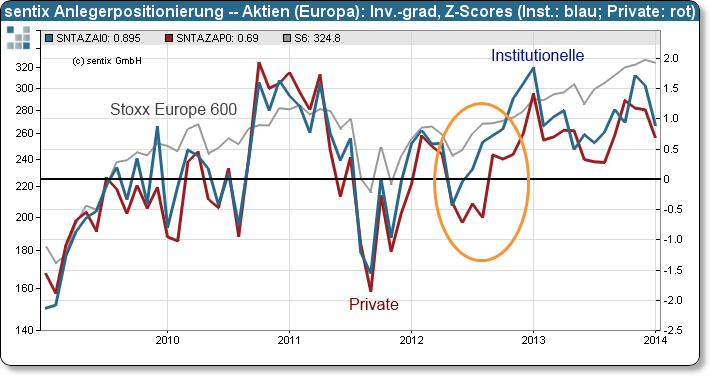
For the sentix investor positioning indices, there are - as for most sentix indicators - sub-indices of the private and institutional investor groups. Figure 2 shows for the European stock market that these sub-indices often run largely parallel, but that the institutional index tends to have a lead over the private index. This becomes particularly clear in 2012, which also coincides with the euro commitment of ECB President Draghi. Here, the institutional investors obviously understood the implications of Draghi's words much more quickly and then also implemented them in their positioning by buying shares.
Interaction with other sentix indicators
- The sentix Strategic Bias, like the sentix Sentiment (see below), is very closely linked to the sentix Investor Positioning - both for the equity and the bond markets (see Figures 5 and 6). It formally reflects investors' 6-month expectations for the price development on the respective market and - according to our research - thus the (rational) basic convictions of investors. Theoretically, a basic conviction should be followed by a corresponding positioning. If there is a gap between the two, there is a cognitive dissonance - the expectations do not correspond to the facts. This dissonance must be resolved sooner or later. As a rule, this should happen here in the direction of expectations, provided there are no (institutional) obstacles. This would make the strategic bias a leading indicator for positioning. Figures 5 and 6 for the European equity and bond markets show that this is usually the case. The advance of the strategic bias before positioning or the closing of the cognitive dissonance in such a case incidentally means that the number of buyers in a market changes and corresponding price effects result.
- Short-term sentix sentiment, which is shaped by investors' emotions, and positioning can also diverge, leading to cognitive dissonance. For example, if investors are overweight in an asset class and the sentiment shows fear or panic, this usually leads to selling and thus downward pressure on prices. The short-term, emotion-driven motive usually dominates the longer-term motive. If, for example, there is harmony between strategic bias and positioning, but dissonance between positioning and sentiment, the short-term dissonance is usually resolved at the expense of the longer-term consonance. If, for example, there is an overweight in equities in line with an increased strategic bias and short-term fear arises, this positioning will be reduced in most cases. However, this then leads to a new cognitive dissonance, namely between positioning and strategic bias, which subsequently has to be resolved again. The ups and downs of the markets can therefore be explained solely by the permanent opening and closing of cognitive dissonances between short- and longer-term expectations and positioning...
Illustration and examples
Examples of investor positioning
 |
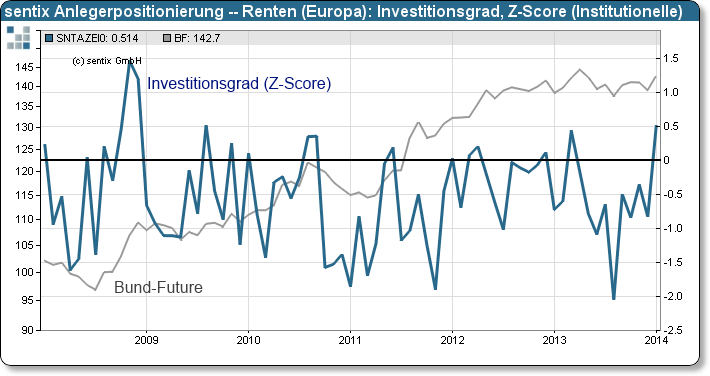 |
| Figure 3: sentix Investor Positioning - European Equities: Overinvestment (Institutional) | Figure 4: sentix Investor Positioning - European Bonds: Investment Grade Z-Scores (Institutional) |
Examples related to the Strategic Bias
 |
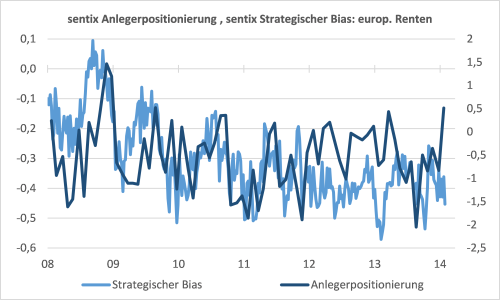 |
| Figure 5: sentix Investor Positioning and sentix Strategic Bias, both for European equities | Figure 6: sentix Investor Positioning and sentix Strategic Bias, both for European bonds |
Indicator construction
Questionaire
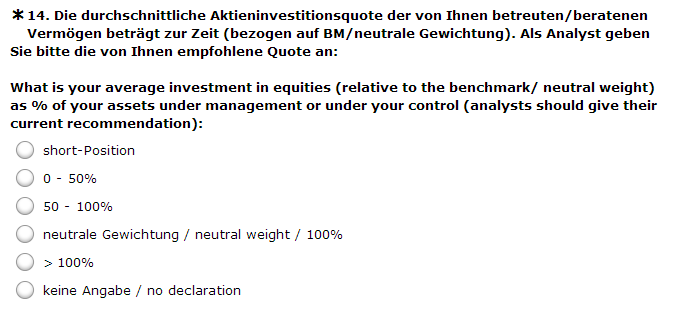
Note: For private investors, there are a total of seven investment degree classes, i.e. two more than for institutional investors, whose questionnaire is shown here. The investment degree classes of private investors are divided into 20 percentage point increments from 0 to 100 %. In addition to these five classes, there is also the investment grade class "short" and the class ">100%".
Note: This survey mask is only available for institutional investors.
Caclculation formula
Step 1
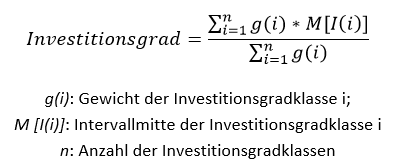
Note: The weights of the investment grade classes correspond to the share of investors who indicated the respective investment grade class in the survey. For the equity investment grade class "short position" a mean investment grade of -10% is assumed, for the equity investment grade class ">100%" a mean investment grade of 110%. For the bond investment grade class "<80%" a mean investment grade of 70% is assumed, for the bond investment grade class ">120%" a mean investment grade of 130%. For the design of the investment grade classes, see "Question" (above).
Step 2

Note: IG: current investment level; µ: mean of investment level observations; σ: standard deviation
Specifications
- Code: SNTA
- No. Serien: 22
- Start: 2002-03-24
- Rhythm.: monthly
- Fristigkeit: Lage
- Investor: Institutionelle, Privatanleger, Headline Index
- Land / Region: Euro area, USA
- Frei verfügbar: sentix Website, Bloomberg L.P.



Customer Feedback (0)