How to use the indicator
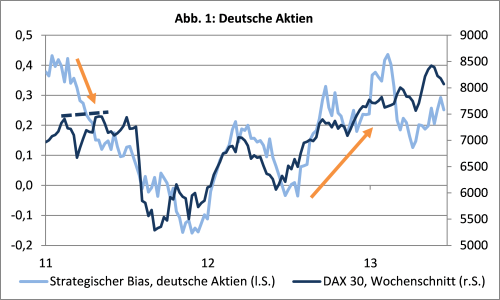 The sentix strategic bias represents the basic convictions of investors. It fluctuates much less than the short-term sentix sentiment, typically forms longer-lasting trends and is usually ahead of the development of the market under consideration. In contrast to the sentix Sentiment, the strategic bias should therefore not be interpreted contrary to the sentix Sentiment, but rather as a directional indicator. It can thus be used for longer-term investment decisions.
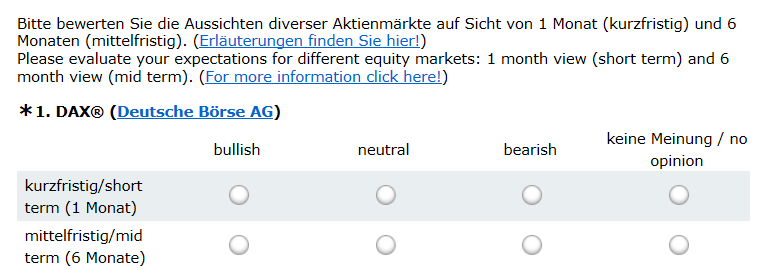
This characteristic - quite unique for sentiment indicators of the financial markets - is due to the fact that since the beginning of its surveys in 2001, sentix has been asking for the respective 1-month expectations in addition to the 6-month expectations for the various markets. Here, the 1-month expectations, the sentix Sentiment, act as a filter for the emotions of the investors. In contrast, the 6-month expectations capture the longer-term convictions of investors. Experience shows that sentiment indicators, in which expectations are only asked about a (usually medium) term, carry both emotions and basic convictions and are therefore more difficult to interpret.
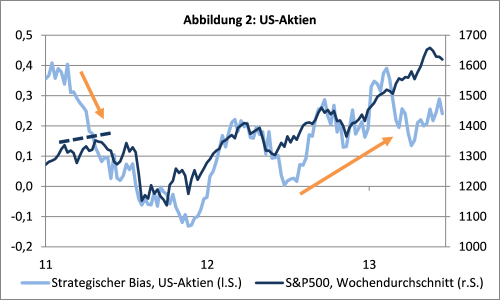
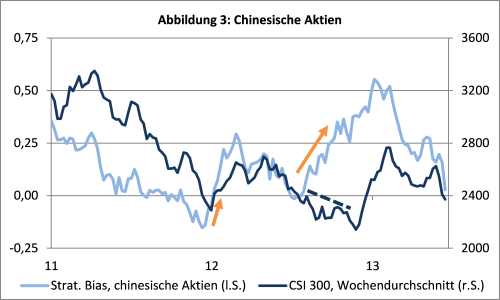
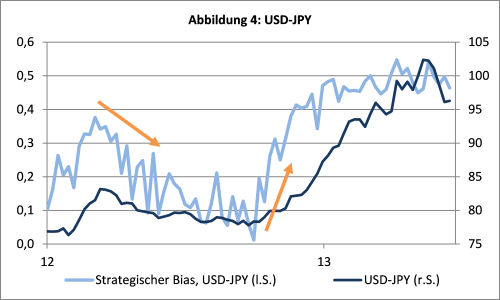
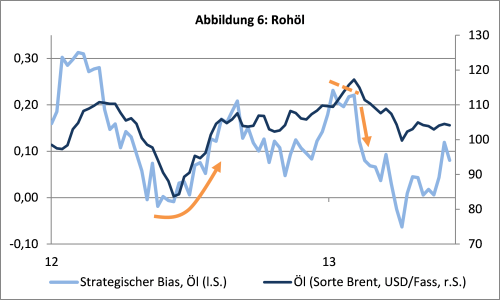
Because the strategic bias predominantly reflects longer-term beliefs and values of investors, it is an indicator that is shaped by the "wisdom of the many": In it, the heterogeneous knowledge scattered throughout the market is bundled together. Its characteristic as a leading directional indicator can be seen in the graphs shown here. Particularly impressive was the trend of the strategic bias in the USD-JPY exchange rate in 2012 and 2013. The same applies to the - even smoother running - strategic bias time series for gold and crude oil and their associated prices. In some phases, the strategic bias has a particularly long lead time over the corresponding market prices. In such cases, the developments of the two time series can also run in opposite directions over a longer period of time. This often offers extraordinary opportunities to profit from upcoming market movements. Illustrative examples can be found in the charts here for German and US stocks in spring and summer 2011 (Figs. 1 and 2) or for Chinese stocks in the second half of 2012 (Fig. 3).
The sentix strategic bias is also suitable for inter-market observations, as it is collected for all 14 financial markets using the same method and at the same time. If the strategic bias for two markets shows correspondingly contradictory developments, they can be "played" against each other. In order to make these developments comparable, a normalisation of the data series, i.e. the use of Z-scores, is recommended.
The strategic bias can also be used to determine the correct time to enter or exit markets. However, it makes sense not to use it exclusively as a basis for such a decision. Rather, a number of other sentix indices are available which, in combination with the strategic bias, optimise the timing:
First of all, it is advisable to also take into account the sentix investor positioning, which is collected for stock and bond markets. The positioning usually follows the strategic bias. However, an adjustment is sometimes hesitant here, for example if risk budgets are tight or other institutional obstacles exist. If the positioning has already developed in the direction of the strategic bias and is then even in extreme areas, there is a risk that the market under consideration can no longer "breathe" in the given direction and thus - despite a pronounced basic conviction - a price correction occurs.
The sentix Business Cycle Index and the sentix Styles Index are also suitable for flanking the strategic bias. They help to identify what drives the latter - changing economic expectations, for example, or a changing risk aversion, which is reflected in the time series of the sentix Styles Index. Finally, the sentix sector Sentiment complements the strategic bias for the European stock market: It shows which sectors are currently "in vogue" among investors and whether the current form of the strategic bias fits the typical rotation between defensive and offensive stocks.
The combination of the strategic bias with the sentix sentiment has already been discussed above (in the introductory text). A concrete combination of sentiment and strategic bias that can be used for timing is the sentix time difference index.





Customer Feedback (0)