How to use the indicator
Unlike the other sentix indicators, the
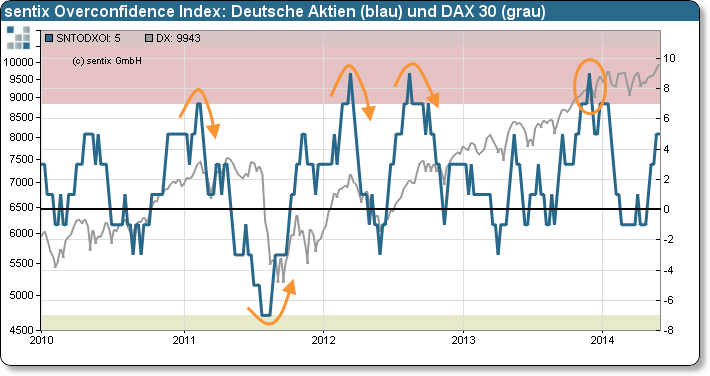
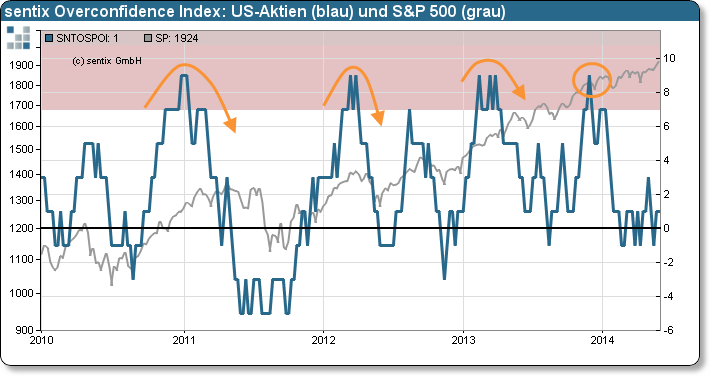
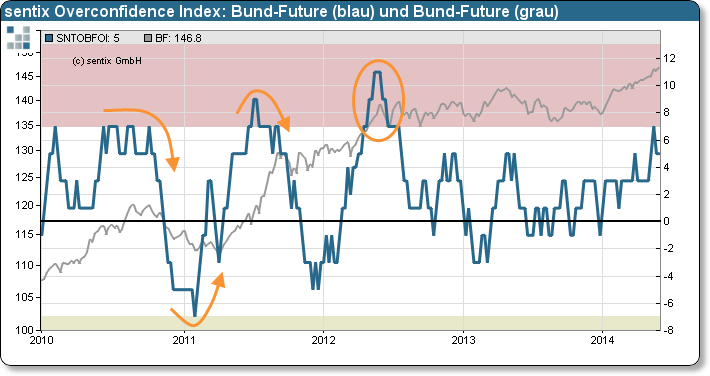
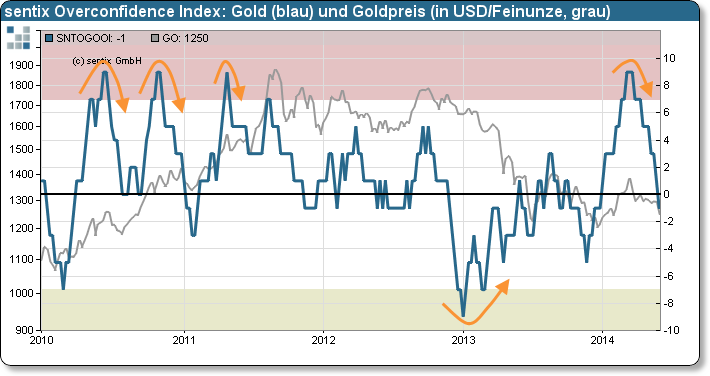
sentix Overconfidence Index is not collected via the sentix Global Investor Survey, but is calculated from the price movements on the respective financial markets. Formally, the sentix Overconfidence Index indicates how often prices on a market have risen or fallen in the recent past: The higher the index rises, the more often prices have recently risen on a weekly basis; the lower the index, the more often prices have fallen. Compared to a coin toss, the indicator determines whether heads or tails fall more often in a defined series of tosses.
The usefulness of the indicator lies in the following consideration: If heads or tails fall conspicuously often in such a coin game, the players would doubt the fairness of the coin after a certain point. The players would suspect that the coin could be marked. It is similar in the financial markets. If a market tends to go up much more often than it goes down, at a certain point investors suspect that the market has a bias, a trend.
This makes such a market seemingly easier for investors to forecast. The subjectively perceived confidence in the market increases, and overconfidence can develop among investors. Such overconfidence, in turn, usually has a direct effect on the positioning behaviour of investors, since investors in apparently easy markets tend to stretch their risk budgets more. Based on this consideration, it is therefore recommended to complement the sentix Overconfidence Index with suitable indicators for investor positioning, e.g. the sentix Investor Positioning Indices.
In addition, the sentix Overconfidence Indices are also suitable as technical indicators, which reflect the market dynamics without, however, only reflecting the momentum in a different way. This is because the respective extent of the price movements plays no role in the calculation of the index. The only decisive factor is the direction of the respective weekly change.
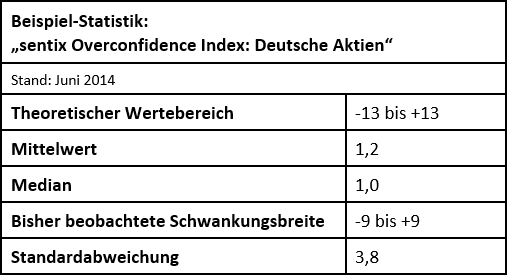
The sentix Overconfidence Index is normalised to values between -13 and +13. If the index takes on values beyond the interval of -7 to +7, the probability is high that investors may already have a high degree of trend perception and thus a high degree of overconfidence and carelessness. The higher the investors' positioning, the higher the potential for a movement against the trend.



Customer Feedback (0)