|
22 April 2014
Posted in
Special research
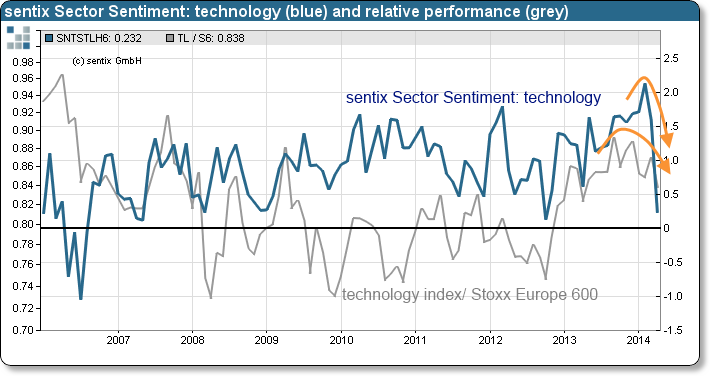
After having reached an all-time high in February, sentix Sector Sentiment for European technology stocks now experiences its second-largest drop since its launch in 2002. Nevertheless, investors still expect the sector to outperform over the coming months. That means more trouble ahead for technology stocks!
sentix Sector Sentiment for European technology stocks falls by 1.35 to now +0.23 standard deviations in the current month (see "background" below for an explanation). This is its second-largest drop since its introduction in 2002. Only in May 2002 when the last hot air escaped the dotcom bubble the indicator had even fallen by more than now.
Just two months ago sentix Sector Sentiment for technology stocks had reached an all-time high when, among other things, Facebook had announced its take-over of WhatsApp and thus provided a sentiment boost for tech stocks in general. At that time, we had pointed out that this was a clear signal for a correction of the sector's share prices. The dropping sentiment can now again be explained by the developments in the US where the NASDAQ indices have recently produced remarkable setbacks.
Furthermore, it is noteworthy that despite this month's heavy drop technology sentiment remains in positive territory meaning that investors still expect the sector to outperform over the coming months. But the relative performance of tech titles is pointing downwards in trend for quite some time already. This should make more investors adapt their expectations to the downside sooner or later and lead to further pressure on the relative performance of the sector. The structural optimism (see graph) for tech stocks which could be observed since 2006 finally seems to have come to end.

Background:
The current sentix Sector Sentiment survey was conducted from April 17 to April 19, 2014. 848 individual and institutional investors took part in it.
sentix Sector sentiment is a monthly survey which is conducted since 2002 among individual and institutional investors via the internet. The survey is run around the third Friday of each month. Investors are asked about their six-month expectations regarding 19 European stock sectors. They can indicate whether they expect a sector to outperform, to perform as the market or to underperform. The survey results are normalised over all sectors and calculated as so-called z-scores. Z-Scores are standard deviations from the mean of a given sample. A value of +1 for a sector sentiment then means, for instance, that the expectations for the sector stand one standard deviation above the mean over all sectors.


