|
20 February 2018
Posted in
Special research
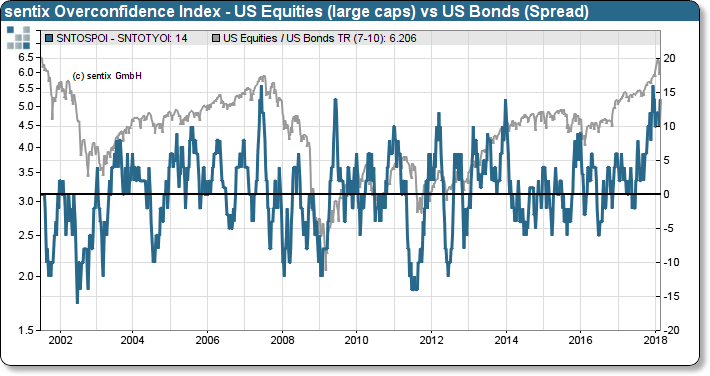
In December last year, we published an unusual data constellation at this point. While the sentix overconfidence in-dex for equities showed an upper extreme, indicating increased risk exposure, the counterpart for US bonds was at a low. The difference between the two observations produced an extreme signal, which had only been reached once before - on the eve of the financial crisis. Now, in February 2018, another such extreme signal is emerging. A unique repetition!
The sentix Overconfidence Index measures whether investors tend to naively continue the trend of a market. This is risky investor behaviour. If the index reaches values of +/- 7, this is called dangerous overconfidence. There is currently such a signal for US equities (+7) and US bonds (-7). Investors therefore place great emphasis on continuing the positive stock market trend and the negative bond trend. This is surprising in view of the sharp stock market correction at the beginning of the month, which was triggered to a large extent by the weak bond market.
sentix Overconfidence Index US equities (large caps) and relative performance Equities vs. Bonds
If you look at the chart above, which shows the difference between the two indices, the uniqueness of the data con-stellation becomes visible. Whenever confidence in equities relative to bonds was so great, severe corrections in the relative performance of equities to bonds were close. That should be the case this time, too. Just how violent such movements can be has been impressively demonstrated by the recent past.


